


Image: Freepik
If you are an AWS beginner, or even an avid AWS user, you may experience times when your EC2 instance grinds to a halt for no apparent reason. This impact to performance is because you hit a limit, and are now being throttled. In any server, there are four resources you need to monitor:
- CPU
- Memory (RAM)
- Disk I/O
- Network I/O
If even one of these hit a limit, you will experience slow performance on your server. EC2 instances are no different. You need to know how to diagnose which of the above resources are constrained. Luckily, AWS provides CloudWatch metrics you can use to get a quick glance at your instance to determine if you are experiencing any issues.
CloudWatch metrics for your EC2 instance#
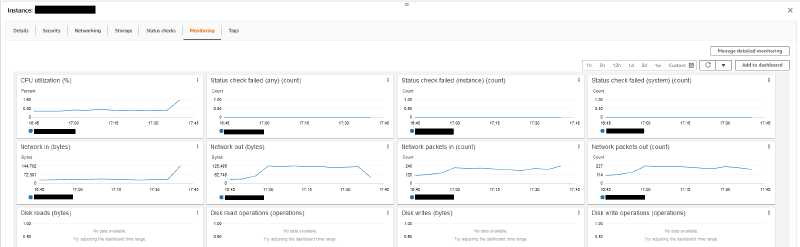
If you were to select the Monitoring tab in your EC2 console, you would see a bunch of metrics related to your EC2 instance. You can see the CPU usage (CPUUtilization, and CPUCreditBalance which is explained further below) and Network usage (NetworkIn, NetworkOut, NetworkPacketsIn, NetworkPacketsOut). A full list of metrics are listed in the CloudWatch metrics that are available for your instances documentation.
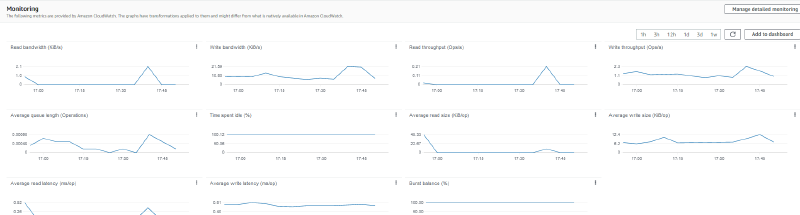
However, you may notice that there are DiskReadOps and DiskWriteOps metrics, but these metrics are sometimes empty. This is because these metrics refer to instance storage volumes, and would thus only be populated for instances which are configured to use instance store volumes. The storage used by most instances, and is the root volume for all current generation instance types, are EBS volumes. EBS volumes are decoupled from EC2 instances to ensure availability of your data when there are issues with your instance. As such, you would need to navigate to the EBS console and locate the volumes attached to your instance in order to view your EBS usage.
And finally, there are no metrics for memory usage. AWS does not record memory usage of your EC2 instance by default. In order to record the memory usage, you need to perform the additional step of setting up the CloudWatch agent to send memory usage to CloudWatch.
However, if you can’t access the CloudWatch metrics in the console for some reason (maybe you are in an Organization, and you have not been granted access), you can still monitor all of the above metrics from within the EC2 instance. If you are using Linux, you can use the top command to obtain an overview of your system, and on Windows you can use Task Manager.
Linux - The top command#
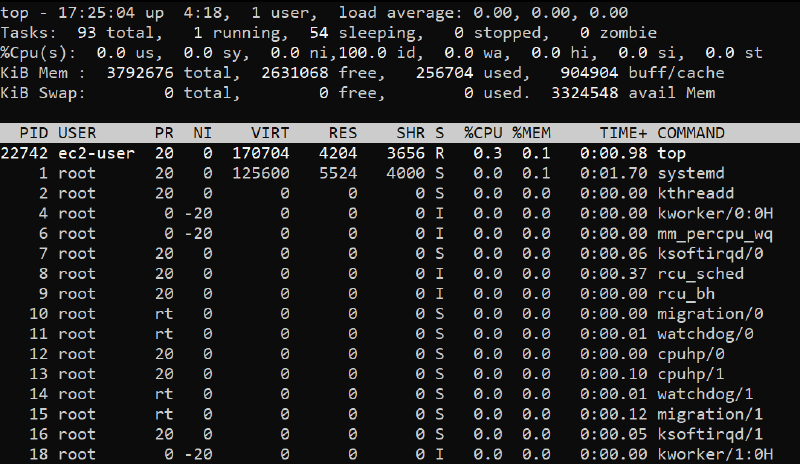
The top command is an easy way to gain an overview of the system. You can view the CPU and memory usage of your system, as well as per process. There are no readings for disk and network metrics, but we can diagnose if there are any issues with these metrics using the load average. The load average measures the amount of load on your system, and includes processes using CPU, as well as processes waiting to use CPU. Such processes contribute to the iowait metric. As such, if load average is high but CPU usage is low, then that means that your system is suffering from I/O wait. In this case, you would usually see a large number of processes stuck in D state, indicating they are waiting for I/O to complete.
However, if you would like to monitor network and disk I/O, you can look at using sar. sar is a very powerful tool which you can use to view and even record in-depth metrics on your system. sar is part of the sysstat package, hence you can simply install sysstat in order to begin using sar:
Amazon Linux, CentOS, RHEL
$ sudo yum install sysstat -yUbuntu
sudo apt-get update
sudo apt-get install sysstat
I won’t be going through all of sar, but you can view disk and network usage with the below commands:
Disk Usage#
Command
$ sar -p -d 1 1Output
Linux 4.14.256-197.484.amzn2.x86_64 (ip-10-0-138-139.eu-west-1.compute.internal)        02/10/22        _x86_64_        (2 CPU)

17:45:01          DEV       tps  rd_sec/s  wr_sec/s  avgrq-sz  avgqu-sz     await     svctm     %util
17:45:02      nvme0n1      0.00      0.00      0.00      0.00      0.00      0.00      0.00      0.00

Average:          DEV       tps  rd_sec/s  wr_sec/s  avgrq-sz  avgqu-sz     await     svctm     %util
Average:      nvme0n1      0.00      0.00      0.00      0.00      0.00      0.00      0.00      0.00
Network Usage#
Command
$ sar -n DEV 1 1Output
Linux 4.14.256-197.484.amzn2.x86_64 (ip-10-0-138-139.eu-west-1.compute.internal)        02/10/22        _x86_64_        (2 CPU)

17:45:41        IFACE   rxpck/s   txpck/s    rxkB/s    txkB/s   rxcmp/s   txcmp/s  rxmcst/s
17:45:42         eth0      2.00      0.00      0.09      0.00      0.00      0.00      0.00
17:45:42           lo      0.00      0.00      0.00      0.00      0.00      0.00      0.00
17:45:42      docker0      0.00      0.00      0.00      0.00      0.00      0.00      0.00
17:45:42         eth1      0.00      0.00      0.00      0.00      0.00      0.00      0.00

Average:        IFACE   rxpck/s   txpck/s    rxkB/s    txkB/s   rxcmp/s   txcmp/s  rxmcst/s
Average:         eth0      2.00      0.00      0.09      0.00      0.00      0.00      0.00
Average:           lo      0.00      0.00      0.00      0.00      0.00      0.00      0.00
Average:      docker0      0.00      0.00      0.00      0.00      0.00      0.00      0.00
Average:         eth1      0.00      0.00      0.00      0.00      0.00      0.00      0.00
Windows - Task Manager#
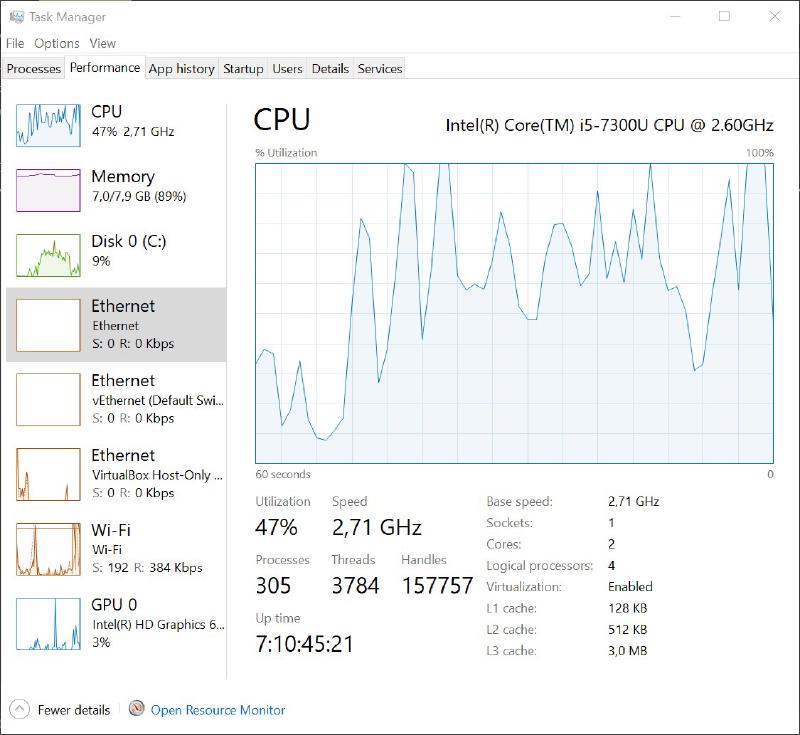
The Windows task manager provides a graphical interface for you to view the overall metrics of your system. The graphs are intuitive and easy to understand.
What do I look for in the monitoring tools?#
As you would have hit a limit for one of the above resources, you cannot use any more of that resource. Projecting that analogy to a graph, this would be seen by a flat line. A PC or server’s usage of resources are not always exactly the same; there would be some slight variance over time. If there is a flat line for any metric, chances are that you are being throttled on that metric.
When you notice a flat line, you should check the details for your instance or EBS volume to determine the available limits. For CPU and memory, a value which is consistently at 100% is a sign of CPU and memory pressure. Similarly, Task Manager would also consistently be at 100%. In top, the output for %Cpu would show 0.0 idle indicating that the CPU is completely busy, and there would be no available memory.
On the other hand, network performance and EBS performance would have a definite value, not a percentage. If you hit a limit, the CloudWatch metric and Task Manager output would flatline at this value. In top, you would see a high value for load average, as well as a high value for iowait. If using sar, you would see that the values returned over a period of time would be similar in value.
However, there may be times when the network, CPU, or EBS performance flatlines, and the values seen are not the advertised limits. In this case, that resource is a burstable resource, and is being throttled on the baseline performance.
The AWS Burst Model#
AWS incorporates a burst model when using a vast majority of their services. In an EC2 instance, as it is a VM and is on a shared underlying host with other customers, these limits are in place to ensure that you can go above your baseline limits during high workloads, but the throttle is in place so that other instances on the host are unaffected (this behaviour varies per instance type).
To explain the burst model, for a specific resource, you are allocated a baseline performance. The baseline performance is over a set time period, usually per second. However, to account for spikes in workloads, your instance can go above the baseline performance for a short period of time using burst credits. If you sustain this usage, the burst credits would steadily be used up until it is depleted, and then you will be throttled back to the baseline performance. If the usage drops below the baseline performance, burst credits would begin to accumulate once again.
To explain by means of an example, the t2.micro is a general performance instance type, with a burstable CPU performance. By default, it has 1 vCPU, and a baseline performance of 10% of that vCPU. As soon as you begin to use more than 10% CPU, CPU burst credits are used. As soon as the credits are exhausted, the instance is throttled to 10% CPU usage.
This burstable model is in place for the below resources:
- CPU usage for T2, T3, T3a, and T4g instance types. The baseline performance differs between each instance type. These are referred to as Burstable Performance Instances.
- EBS IOPS usage on gp2 EBS volumes.
- Network performance on a variety of instance types. This is documented in the Amazon EC2 instance network bandwidth documentation.
CPU and EBS burst details are documented clearly, and you can measure the amount of burst balance remaining for each resource. However, you cannot view the burst balance for network performance. You can only view the baseline performance per instance type in the above documentation.
How do I proceed after identifying the throttled resource?#
The first step would be to try and fix the usage. In Task Manager, you can view which process is using up the specified resource. In top, you can identify which process is using up the most CPU and memory, as well as determine which processes are in D state to diagnose network and disk hungry processes. Once identified, you should examine each process to see if this is expected. You can check the logs for that process if possible to see of there was any unusual occurrences. However, if you notice that the resource was slowly and steadily increasing, odds are that your instance just got busier over time. However, do not just assume this, always try and confirm.
If you confirm the usage is expected, you then need to allocate more resources to handle the load. In order to increase the resources, you can look at scaling up, or scaling out. Scaling up refers to upgrading the instance type to one which has more of the specified resource. For example, if you are using a t2.micro, you can update to a t2.medium. Scaling out however means to increase the number of instances. This is useful if you are able to make use of multiple instances simultaneously in your application, for example, by means of a load balancer.
In the case of gp2 EBS volumes however, you should instead look at migrating to gp3 volumes. gp3 volumes do not use baseline performance and burst credits. You specify the IOPS and throughput you need, and you will receive consistent performance at those IOPS. g3 volumes are also slightly cheaper than gp2 volumes. For more information, you can refer to the EBS pricing page.
Summary#
We can recap the above blog with these points:
- Your instance can hit a limit on CPU, memory, network, and/or disk which can cause performance issues.
- You can determine which resource is throttled using CloudWatch metrics, or using monitoring tools from within the instance.
- When looking at usage, look for a flatline or similar values in the metrics.
- Don’t forget to take into account burstable resources when using certain instance types.
- After identifying the issue, determine if this is expected or an anomaly.
- If expected, you can scale up or scale out, depending on your business needs
This article can help those using EC2 and seeing performance issues, and provides and end-to-end guide of identifying the cause, and fixing the issue.