ECS - Monitor container-level CPU and memory using Docker stats and CloudWatch metrics

When using ECS, you run containers in the form of an ECS task, where each task can contain one or more container definitions, up to a maximum of 10. If you want to monitor the performance of your tasks, you can monitor the containers at the task level. This does offer good insight into the working of your task, but it doesn't allow you to view the performance of each container. In a delicate environment where you need to monitor each and every aspect of the system, monitoring each container would be extremely beneficial. There is no CloudWatch metric which monitors container-level resource usage, but it is possible to build our own CloudWatch metric using the container-level resource usage statistics provided by the Docker daemon on the EC2 host. These statistics are obtained by the more widely known docker stats command.
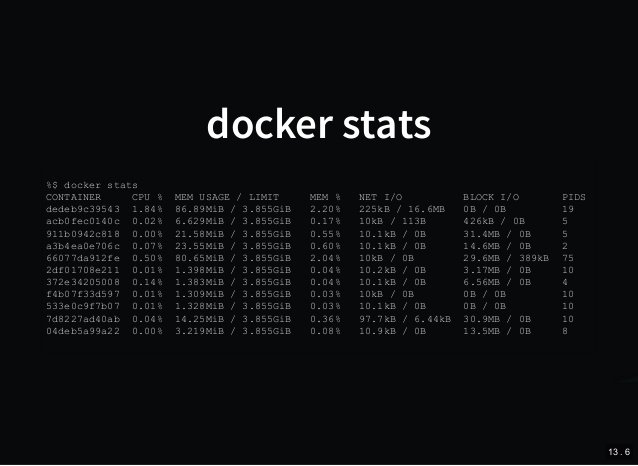
The docker stats command returns a live data stream for running containers. With this command, you would be able to obtain the CPU, memory, network I/O, as well as disk I/O usage of each container. For this post, I will only be covering CPU and memory usage. You can take a more detailed look at docker stats from Docker's documentation.
To provide a short overview of the steps we will be deploying, we will first create a script which obtains the resource usage statistics using docker stats, and upload these values to CloudWatch metrics. The statistics obtained will need to be easily obtained and parsed, hence the statistics will be obtained as a JSON, and be parsed using jq (more on this below). This script needs to be run at set intervals in order to gain a good understanding of the container resource usage patterns. To do this, we will create a cron job which will run this script at a set frequency.
Installing the dependencies
As we will be sending the metrics to CloudWatch, and parsing through the JSON statistics using jq, we need to install the AWS CLI, as well as the jq binary. As you are using ECS, you would most likely be using the ECS-optimized AMI, which is based on Amazon Linux, or Amazon Linux 2. As such, the commands you would use to install these dependencies would be as below:
sudo yum install python3 python3-pip jq -y
sudo pip3 install -U awscli
Creating the script
Let's first look at the commands which will be included in the script.
We first need to obtain the resource usage statistics using docker stats. By default,docker stats is presented as text, which is not very easy to handle when trying to filter for specific values. As such, we can format the statistics into a JSON using the --format parameter. This will be based on a publicly available example docker-stats-json. The statistics will then be formed into a valid JSON object using jq.
STATS=$(docker stats --no-stream --format "{\"container\": \"{{ .Container }}\",\"name\": \"{{ .Name }}\", \"memory\": { \"raw\": \"{{ .MemUsage }}\", \"percent\": \"{{ .MemPerc }}\"}, \"cpu\": \"{{ .CPUPerc }}\"}" | jq '.' -s -c )As we will be uploading the data to CloudWatch metrics, CloudWatch is region-specific. As such we also need to include the region in our script. We can obtain the region programmatically from the metadata service.
REGION=$(curl http://169.254.169.254/latest/meta-data/placement/region 2> /dev/null)We also need a way to identify and structure our metrics in CloudWatch. One good way to manage this is to use the EC2 instance ID as a dimension for the metric, as well as the Container Name, and Container ID. This will allow us to identify the exact container which provided the metric. As such, we first need the EC2 instance ID, which can also be obtained from the instance metadata.
INSTANCE_ID=$(curl http://169.254.169.254/latest/meta-data/instance-id 2> /dev/null)Finally, we need to parse through the JSON to obtain the Container Name, Container ID, CPU, and Memory usage of each container. To do this we first need to obtain the total number of containers.
NUM_CONTAINERS=$(echo "$STATS" | jq '. | length')We then iterate through the JSON to obtain the values we need.
for (( i=0; i<$NUM_CONTAINERS; i++ ))
do CPU=$(echo "$STATS" | jq -r .[$i].cpu | sed 's/%//')
MEMORY=$(echo "$STATS" | jq -r .[$i].memory.percent | sed 's/%//')
CONTAINER=$(echo $STATS | jq -r .[$i].container)
CONTAINER_NAME=$(echo $STATS | jq -r .[$i].name)
And then upload these values to CloudWatch metrics using the AWS CLI.
/usr/local/bin/aws cloudwatch put-metric-data --metric-name CPU --namespace DockerStats --unit Percent --value $CPU --dimensions InstanceId=$INSTANCE_ID,ContainerId=$CONTAINER,ContainerName=$CONTAINER_NAME --region $REGION
/usr/local/bin/aws cloudwatch put-metric-data --metric-name Memory --namespace DockerStats --unit Percent --value $MEMORY --dimensions InstanceId=$INSTANCE_ID,ContainerId=$CONTAINER,ContainerName=$CONTAINER_NAME --region $REGION
done
Putting it all together, the completed script should look as below.
#!/bin/bash

REGION=$(curl http://169.254.169.254/latest/meta-data/placement/region 2> /dev/null)
INSTANCE_ID=$(curl http://169.254.169.254/latest/meta-data/instance-id 2> /dev/null)
STATS=$(docker stats --no-stream --format "{\"container\": \"{{ .Container }}\",\"name\": \"{{ .Name }}\", \"memory\": { \"raw\": \"{{ .MemUsage }}\", \"percent\": \"{{ .MemPerc }}\"}, \"cpu\": \"{{ .CPUPerc }}\"}" | jq '.' -s -c )
NUM_CONTAINERS=$(echo "$STATS" | jq '. | length')

for (( i=0; i<$NUM_CONTAINERS; i++ ))
do CPU=$(echo "$STATS" | jq -r .[$i].cpu | sed 's/%//')
MEMORY=$(echo "$STATS" | jq -r .[$i].memory.percent | sed 's/%//')
CONTAINER=$(echo $STATS | jq -r .[$i].container)
CONTAINER_NAME=$(echo $STATS | jq -r .[$i].name)

/usr/local/bin/aws cloudwatch put-metric-data --metric-name CPU --namespace DockerStats --unit Percent --value $CPU --dimensions InstanceId=$INSTANCE_ID,ContainerId=$CONTAINER,ContainerName=$CONTAINER_NAME --region $REGION
/usr/local/bin/aws cloudwatch put-metric-data --metric-name Memory --namespace DockerStats --unit Percent --value $MEMORY --dimensions InstanceId=$INSTANCE_ID,ContainerId=$CONTAINER,ContainerName=$CONTAINER_NAME --region $REGION

done
Creating the Cron job
For the sake of simplicity, I have placed the above script at /opt/docker-stats-monitor/monitor.sh in my EC2 instance.
We first need to make the above script executable.
chmod +x /opt/docker-stats-monitor/monitor.shWe then need to create the cron job by creating a file in /etc/cron.d.
echo '* * * * * root bash /opt/docker-stats-monitor/monitor.sh' > /etc/cron.d/docker-statsThe above example creates a cron job which obtains and uploads the resource-usage statistics every minute. You can adjust the frequency by changing the cron schedule expression.
The Results
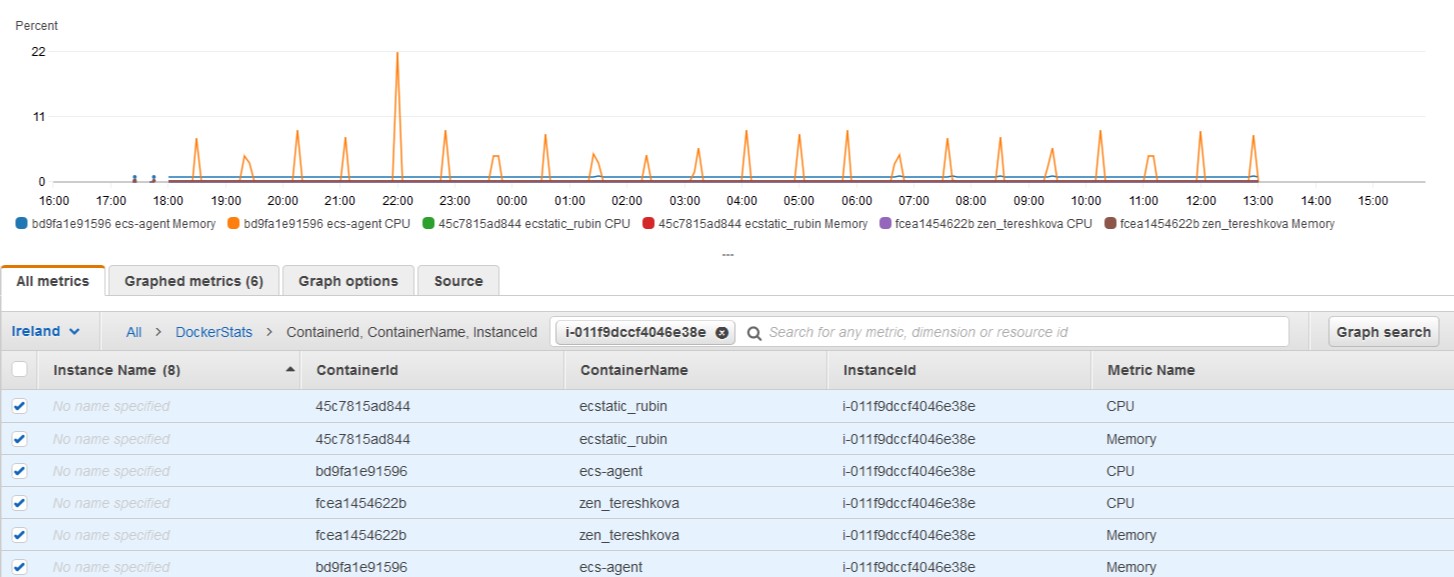
Automating the Procedure
When using ECS, you would hardly access the EC2 host, if at all. You would also most likely be incorporating Auto Scaling or Capacity Providers to launch the EC2 instance, hence you cannot SSH into each instance to configure this setup. To make this a plausible solution, you can implement the above steps using a User Data script.
#!/bin/bash

yum install python3 python3-pip jq -y
pip3 install -U awscli

mkdir -p /opt/docker-stats-monitor

cat > /opt/docker-stats-monitor/monitor.sh << 'EOF'
#!/bin/bash

REGION=$(curl http://169.254.169.254/latest/meta-data/placement/region 2> /dev/null)

INSTANCE_ID=$(curl http://169.254.169.254/latest/meta-data/instance-id 2> /dev/null)

STATS=$(docker stats --no-stream --format "{\"container\": \"{{ .Container }}\",\"name\": \"{{ .Name }}\", \"memory\": { \"raw\": \"{{ .MemUsage }}\", \"percent\": \"{{ .MemPerc }}\"}, \"cpu\": \"{{ .CPUPerc }}\"}" | jq '.' -s -c )

NUM_CONTAINERS=$(echo "$STATS" | jq '. | length')

for (( i=0; i<$NUM_CONTAINERS; i++ ))
do CPU=$(echo "$STATS" | jq -r .[$i].cpu | sed 's/%//')
MEMORY=$(echo "$STATS" | jq -r .[$i].memory.percent | sed 's/%//')
CONTAINER=$(echo $STATS | jq -r .[$i].container)
CONTAINER_NAME=$(echo $STATS | jq -r .[$i].name)

/usr/local/bin/aws cloudwatch put-metric-data --metric-name CPU --namespace DockerStats --unit Percent --value $CPU --dimensions InstanceId=$INSTANCE_ID,ContainerId=$CONTAINER,ContainerName=$CONTAINER_NAME --region $REGION

/usr/local/bin/aws cloudwatch put-metric-data --metric-name Memory --namespace DockerStats --unit Percent --value $MEMORY --dimensions InstanceId=$INSTANCE_ID,ContainerId=$CONTAINER,ContainerName=$CONTAINER_NAME --region $REGION

done
EOF

chmod +x /opt/docker-stats-monitor/monitor.sh

echo '* * * * * root bash /opt/docker-stats-monitor/monitor.sh' > /etc/cron.d/docker-stats
Conclusion
This is a feasible solution for monitoring Docker containers, however one big caveat which you would have noticed is that this solution requires running commands on the EC2 host used for running the containers. This means that this solution can only work for tasks using the EC2 Launch Type, and will not work for Fargate tasks.
And that's all there is to it. Let me know your thoughts in the comments below, and feel free to adjust these steps to meet your use-case, and share with the rest of the community.


Comments